The changing C-suite view of a turbulent economy
An analysis of earnings call transcripts from the S&P 500 to examine surprising executive confidence in the economy
Visualizations by Alyssa Fowers and Leslie Shapiro; data collection and analysis by Alyssa Fowers and Federica Cocco; writing by Jonathan O’Connell
For this story, Federica Cocco and I downloaded PDF transcripts of almost a thousand earnings calls from S&P 500 companies, cleaned and converted the presentation portions into plain text, and analyzed the contents to see what executives were saying about the economy. Northeastern University text analytics librarian Lawrence Evalyn consulted with us to develop a quarter-over-quarter analysis methodology using weighted log-odd ratios.
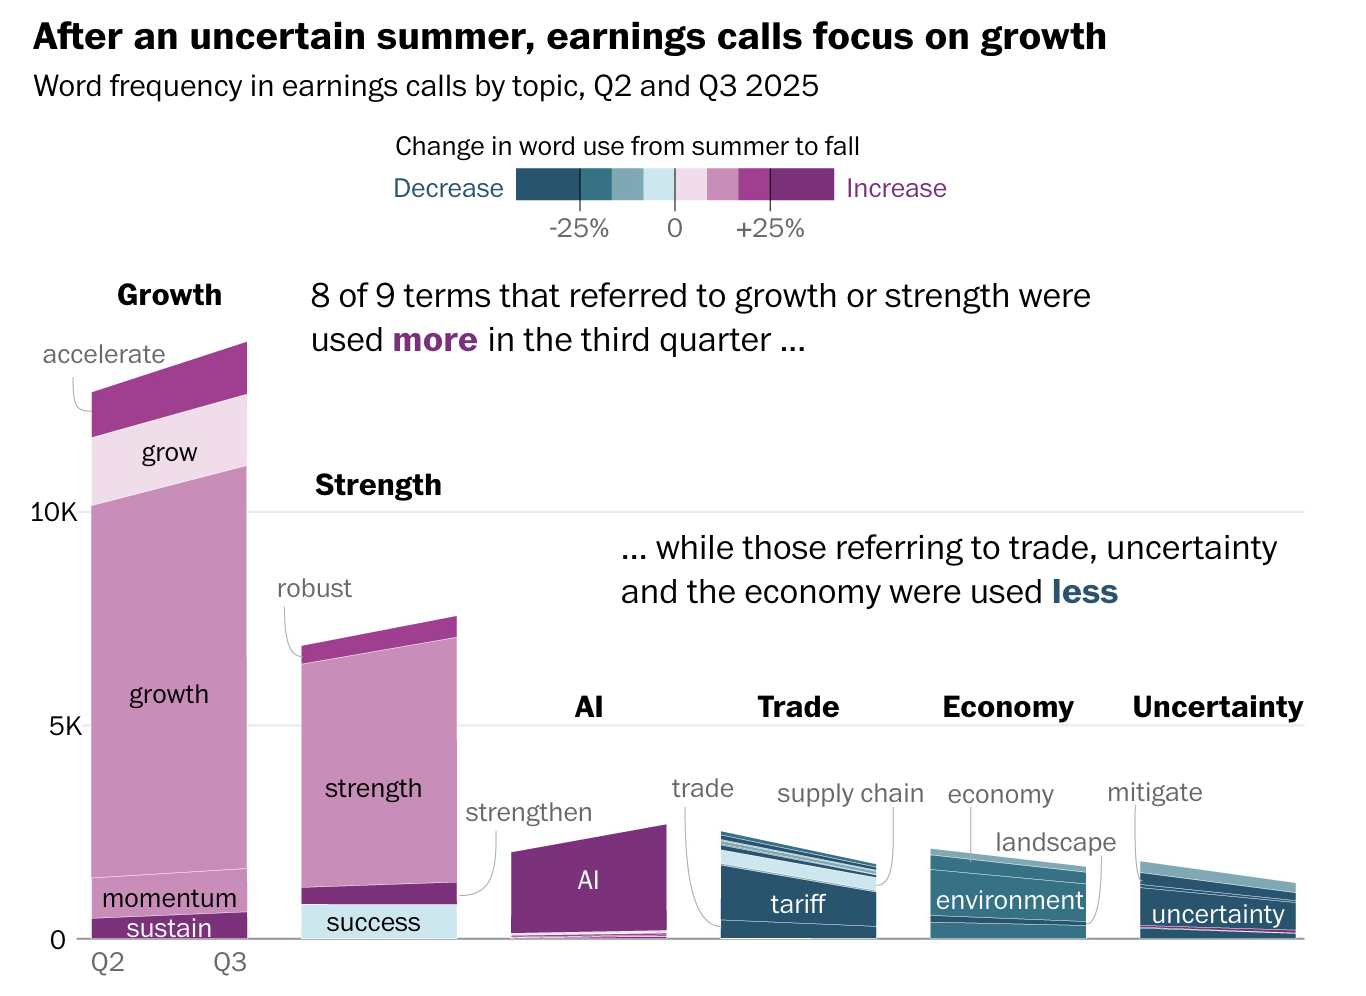
At a time when the American public was increasingly sour on the economy, executives were surprisingly optimistic. They focused on growth and strength in their presentations, with substantially reduced discussion of global trade and almost no mention of immigration.
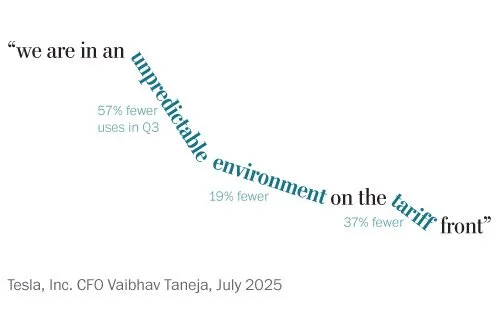
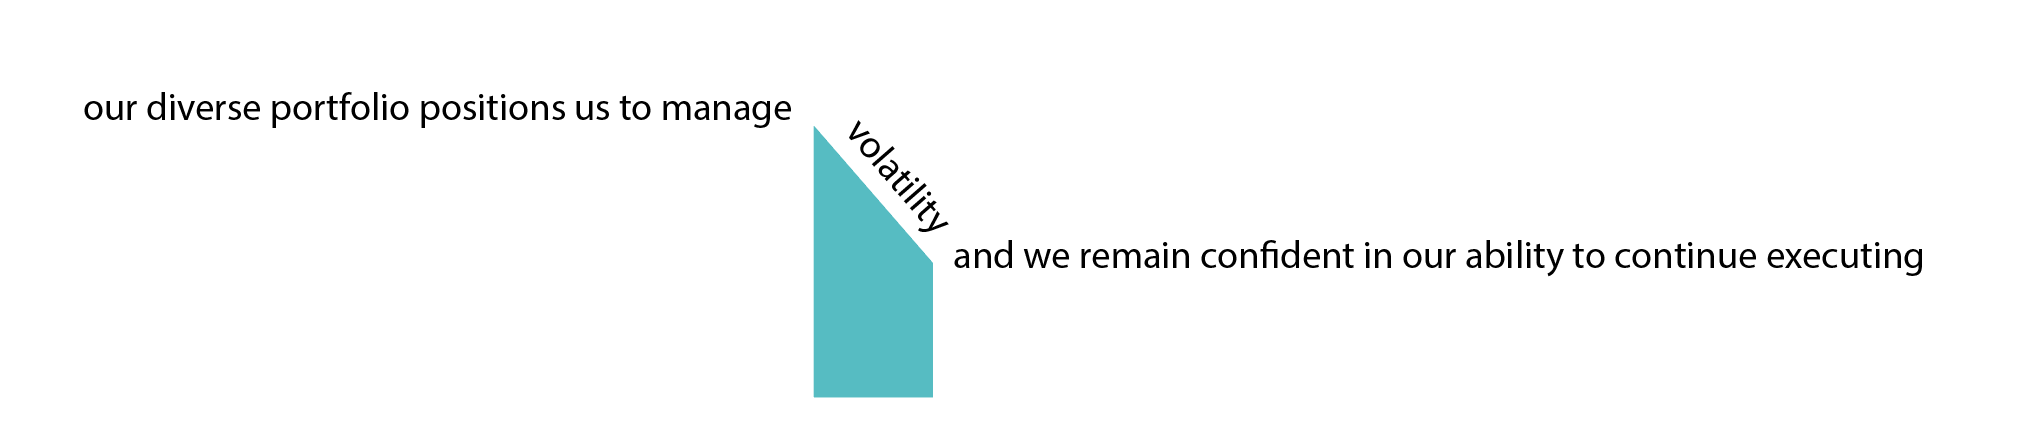
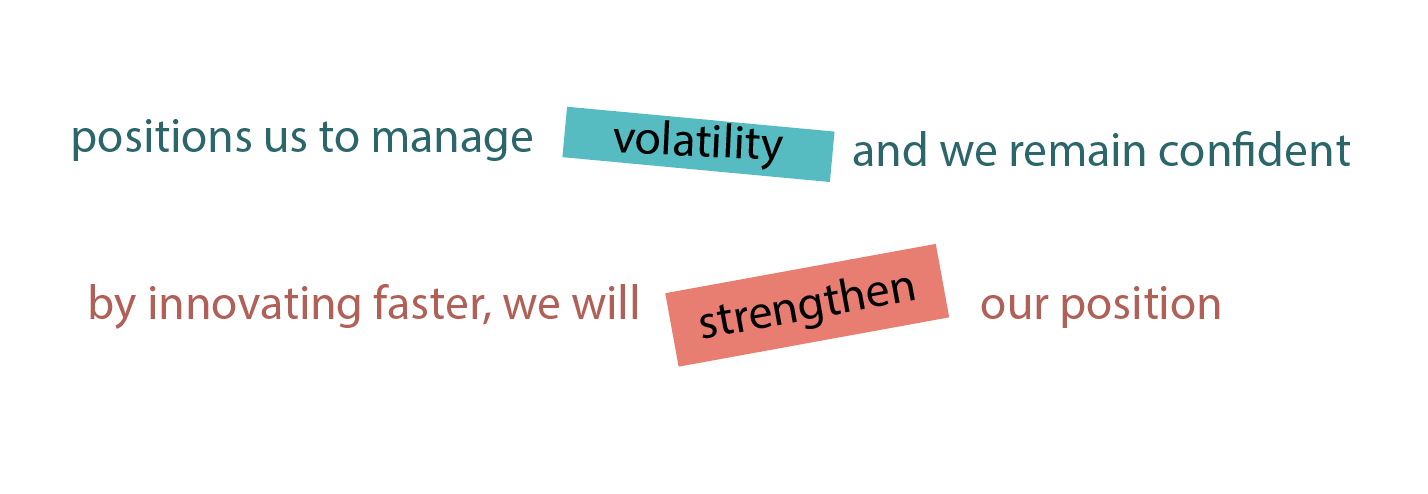
I created an animated scatterplot at the center of the story to show what had changed overall, and used word-tilt throughout the piece to illustrate which words became more or less common from one quarter to the next.
CONCEPT SKETCHES AND ANALYSIS CHARTS
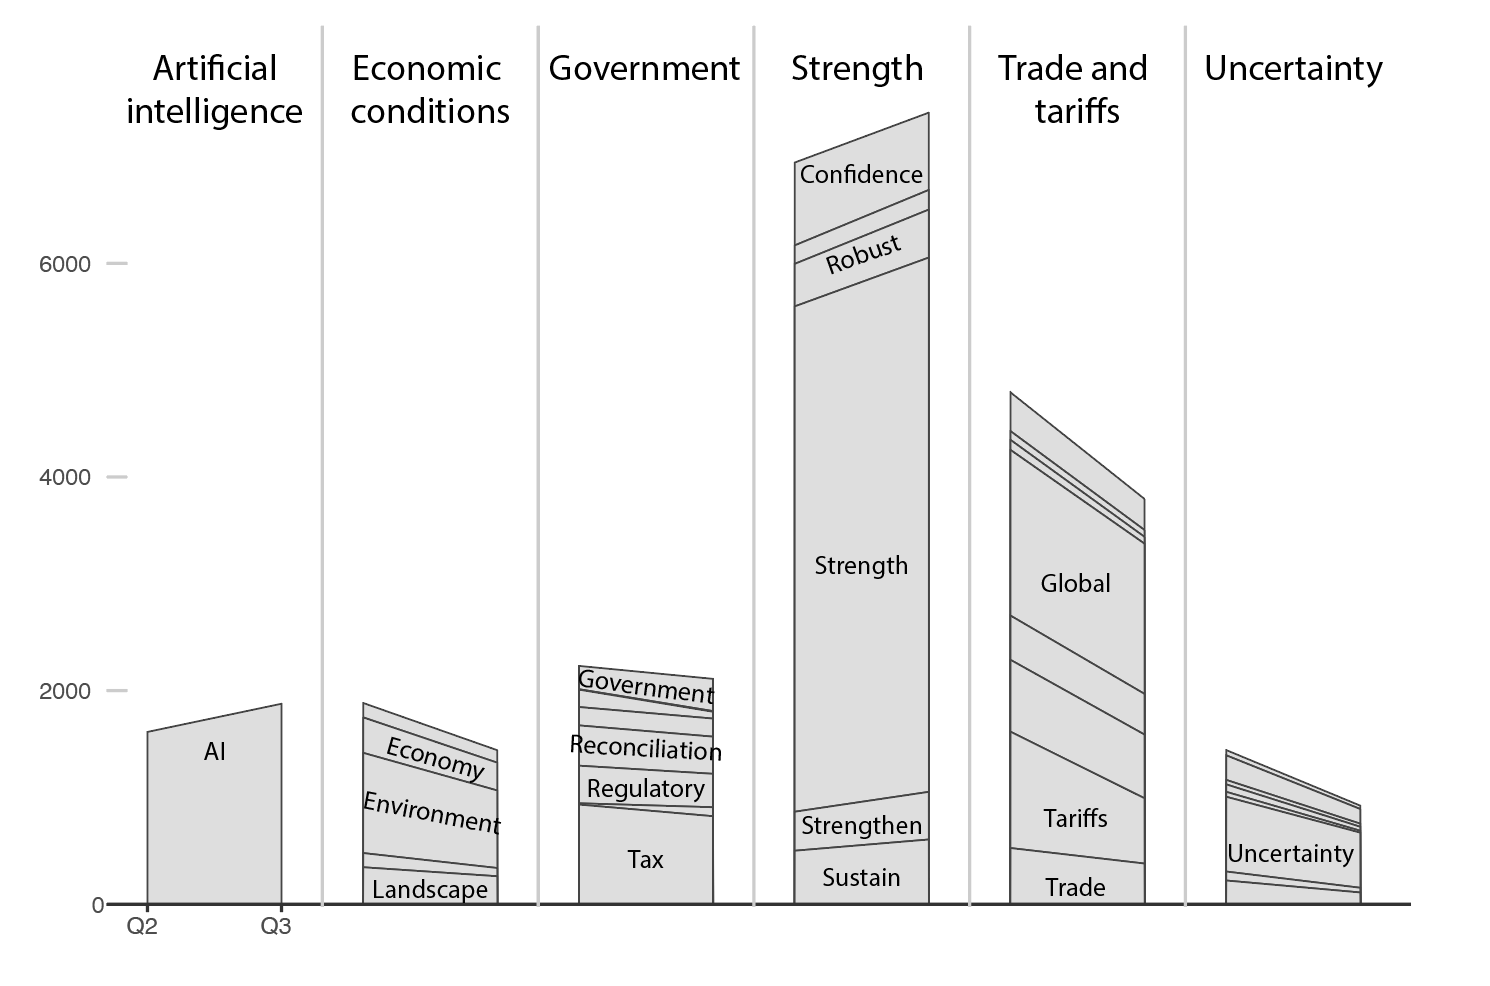
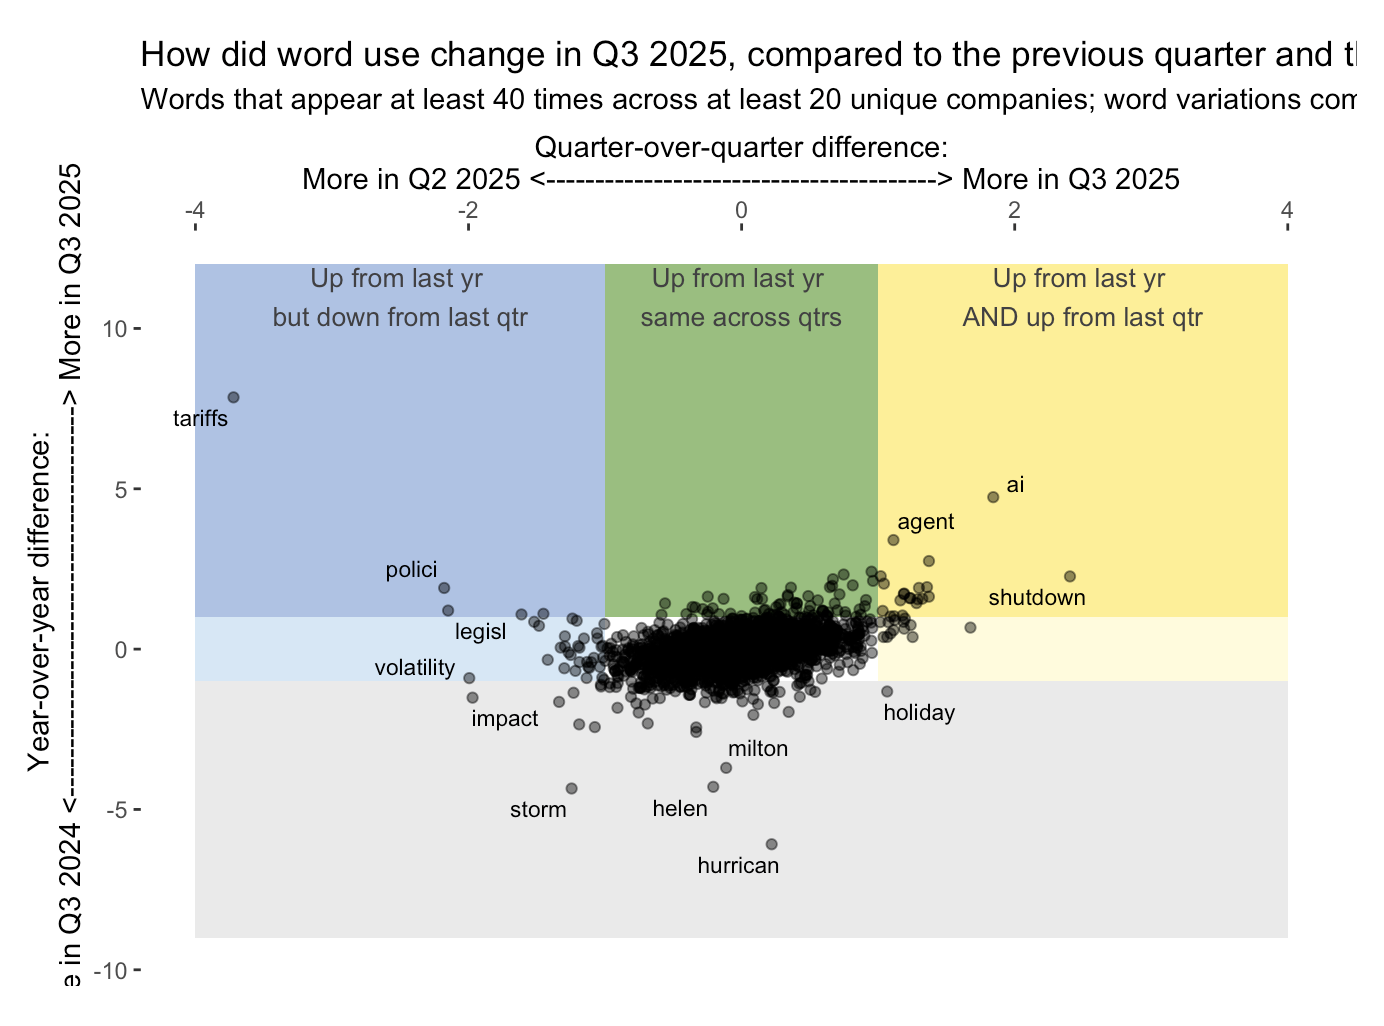
In the initial analysis, I examined year-over-year and quarter-over-quarter change, but decided to focus on quarter-over-quarter change in the piece for the sake of clarity. Here is the exploratory chart I created to look at year-over-year and quarter-over-quarter change in the same view, plus an exploratory chart that shows more detail for quarter-over-quarter change.

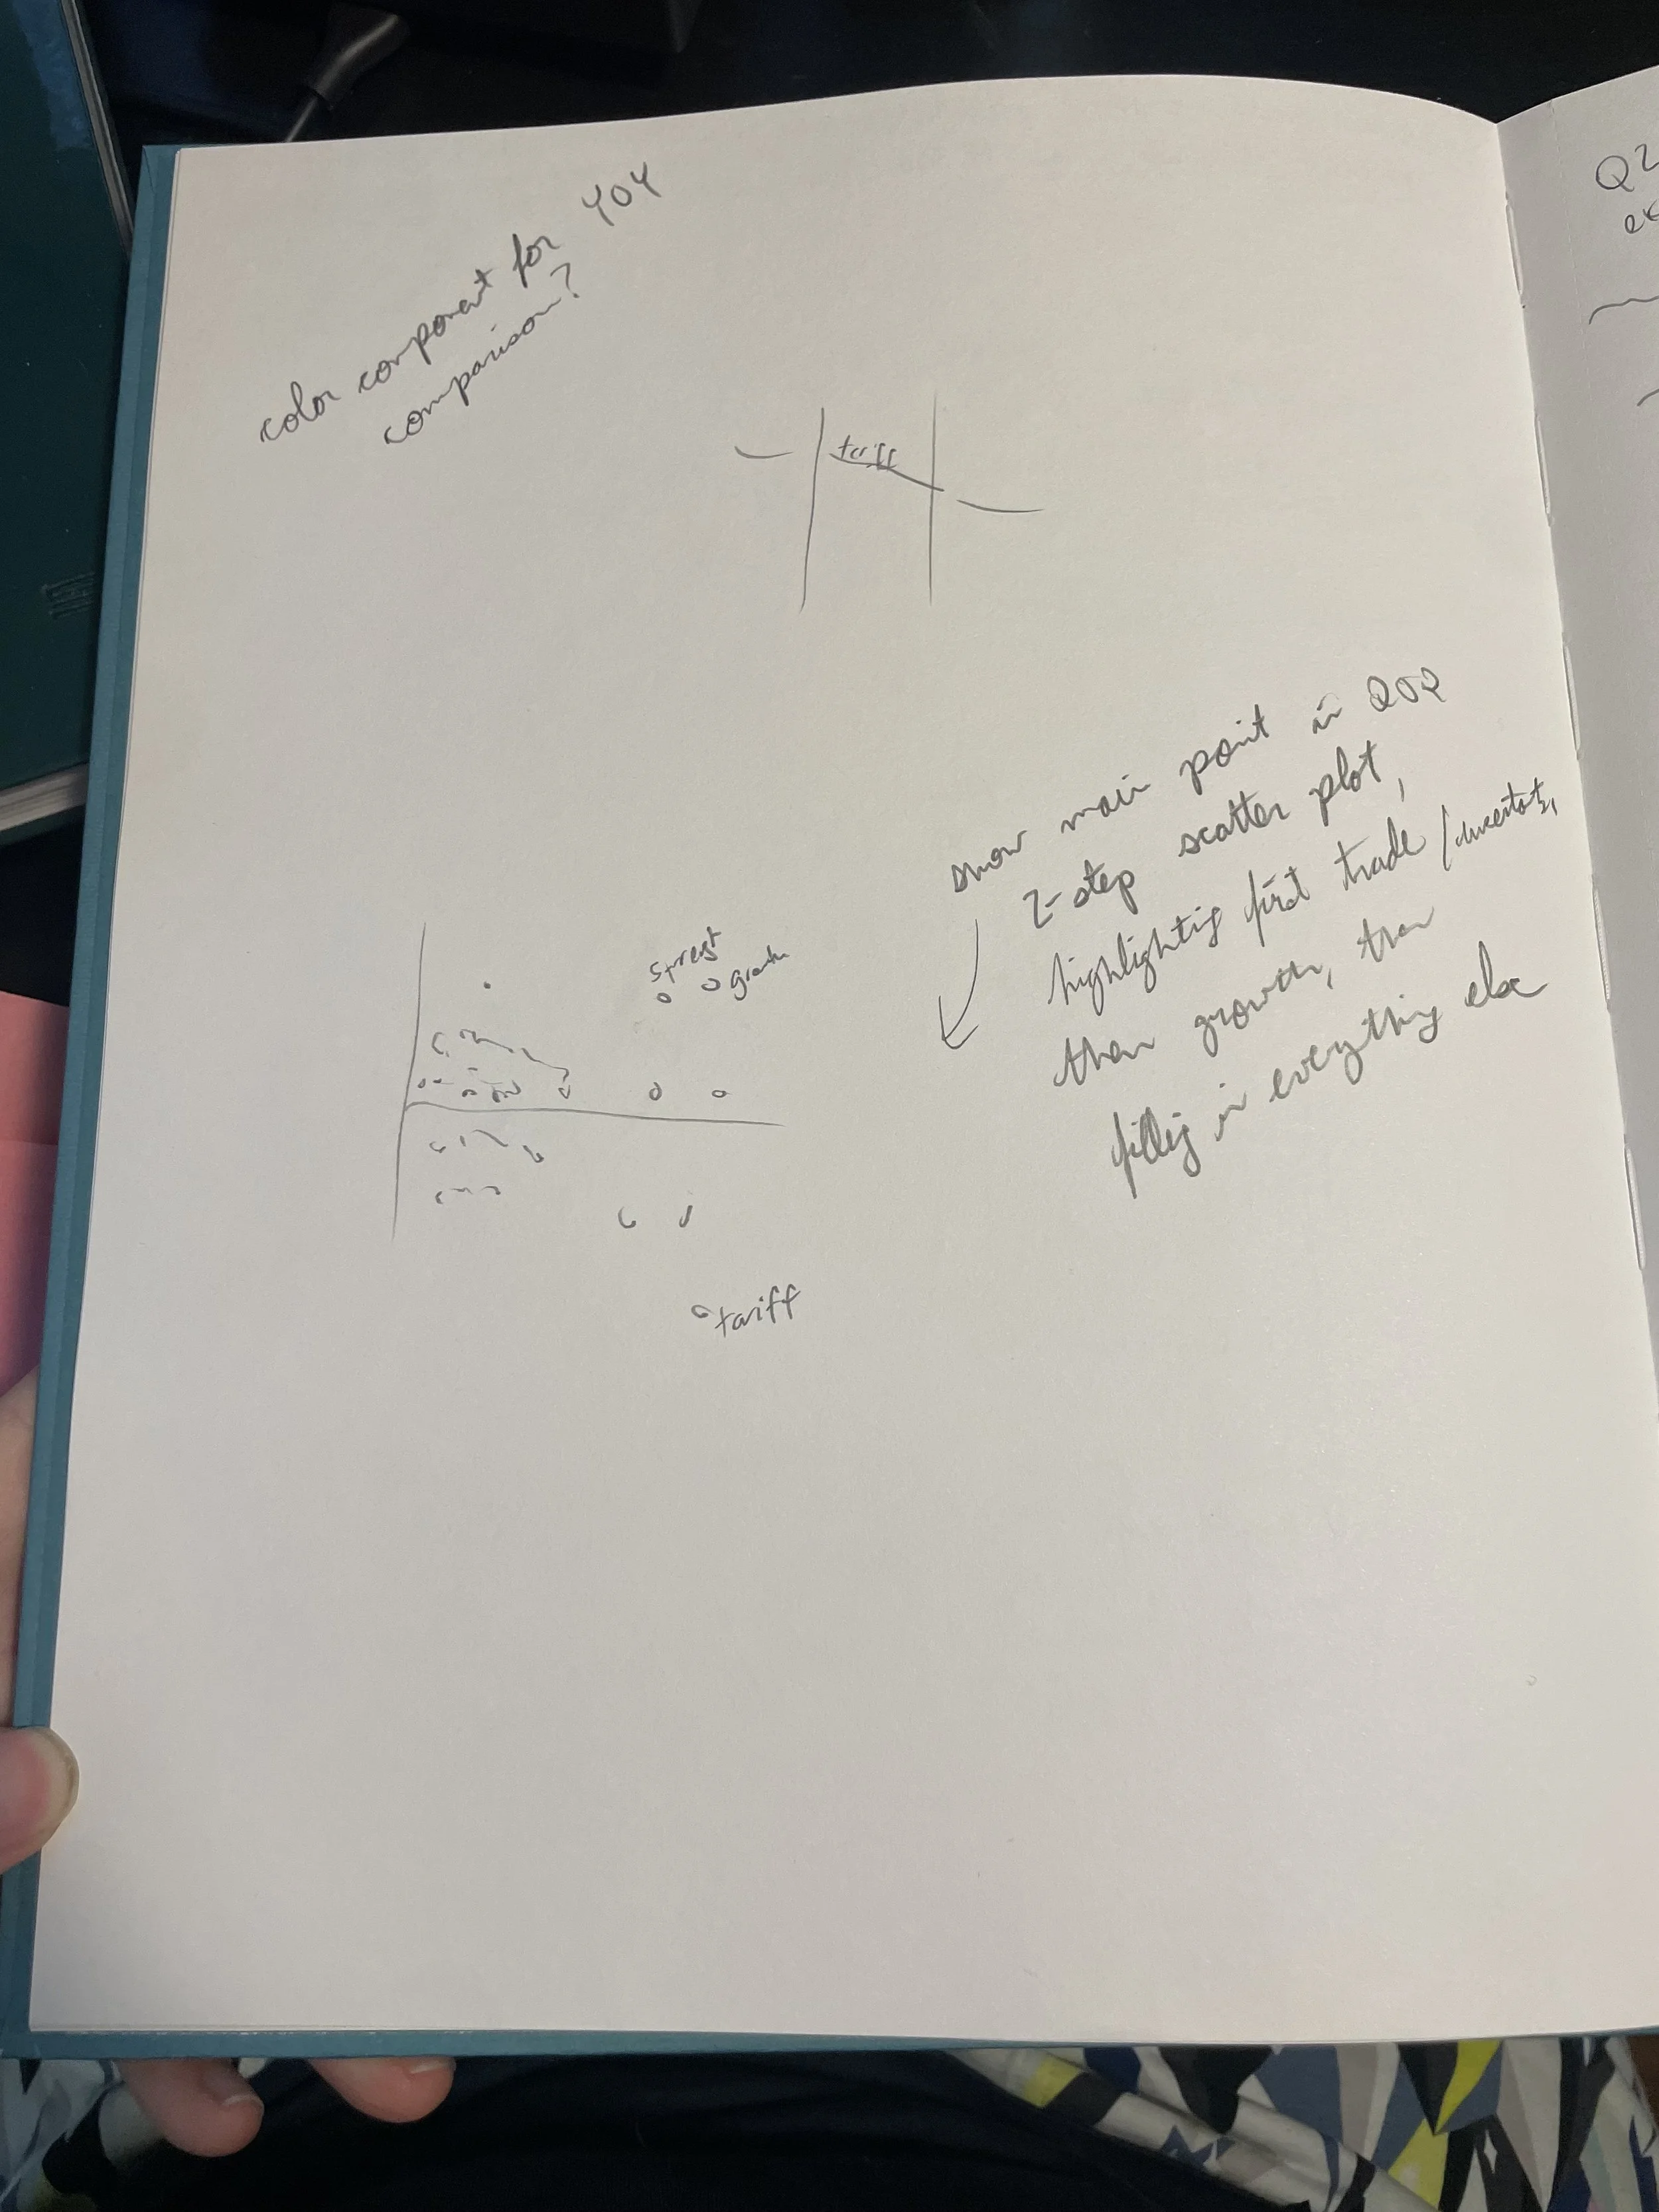
These are my initial hand-drawn sketches while thinking through data visualization graphics for the piece:

And here are some early digital sketches that I shared with my colleagues: