We ranked 5,700 holidays, from Labor Day to World Dracula Day. Which do you celebrate?
Concept, writing and static data visualizations by Alyssa Fowers; data analysis by Alyssa Fowers and Andrew Van Dam; interactive elements by Kevin Schaul; page design by Shelly Tan
This Department of Data piece focuses on a light-hearted topic, but required serious data collection, cleaning, consolidation and analysis, as well as the development of a “realness” scale that balanced seven different sets of criteria.
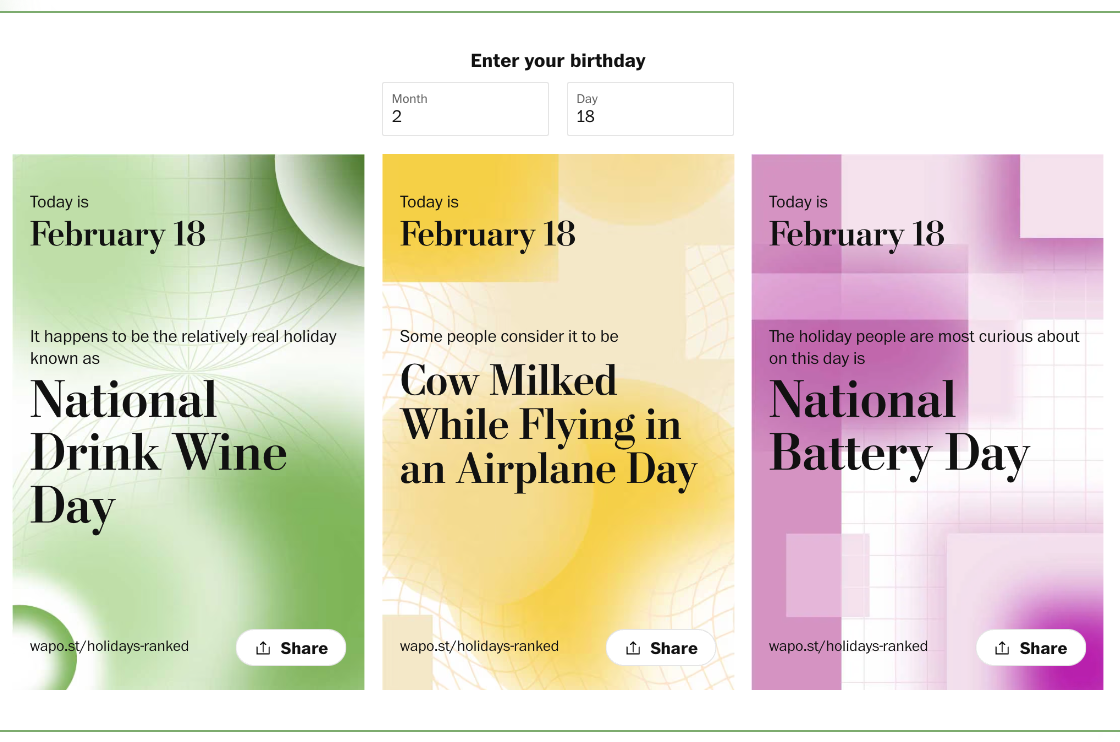
I compiled a comprehensive list of unique non-religious holidays in the United States by pulling data from three holiday websites, one book, Wikipedia, the United Nations, the Office of Management and Budget, and Google search data. We then invited readers to see what holidays fell on their birthdays, and analyzed other patterns and trends among unofficial holidays in 2025.
Finalizing the list required a series of judgment calls: when did holidays about the same topic (but on different dates) “count” as the same holiday, and when were they distinct? What was the distinction between an event and a holiday? How would we pick an official date if our sources disagreed, or if the holiday was on different dates every year? To build our “realness” rating, I had to think outside the box to determine what made something real: is it recognized by official bodies? Is it marked by default on calendars? Does it meet the notability criteria for a Wikipedia article? Is it well-known enough to drive search traffic?
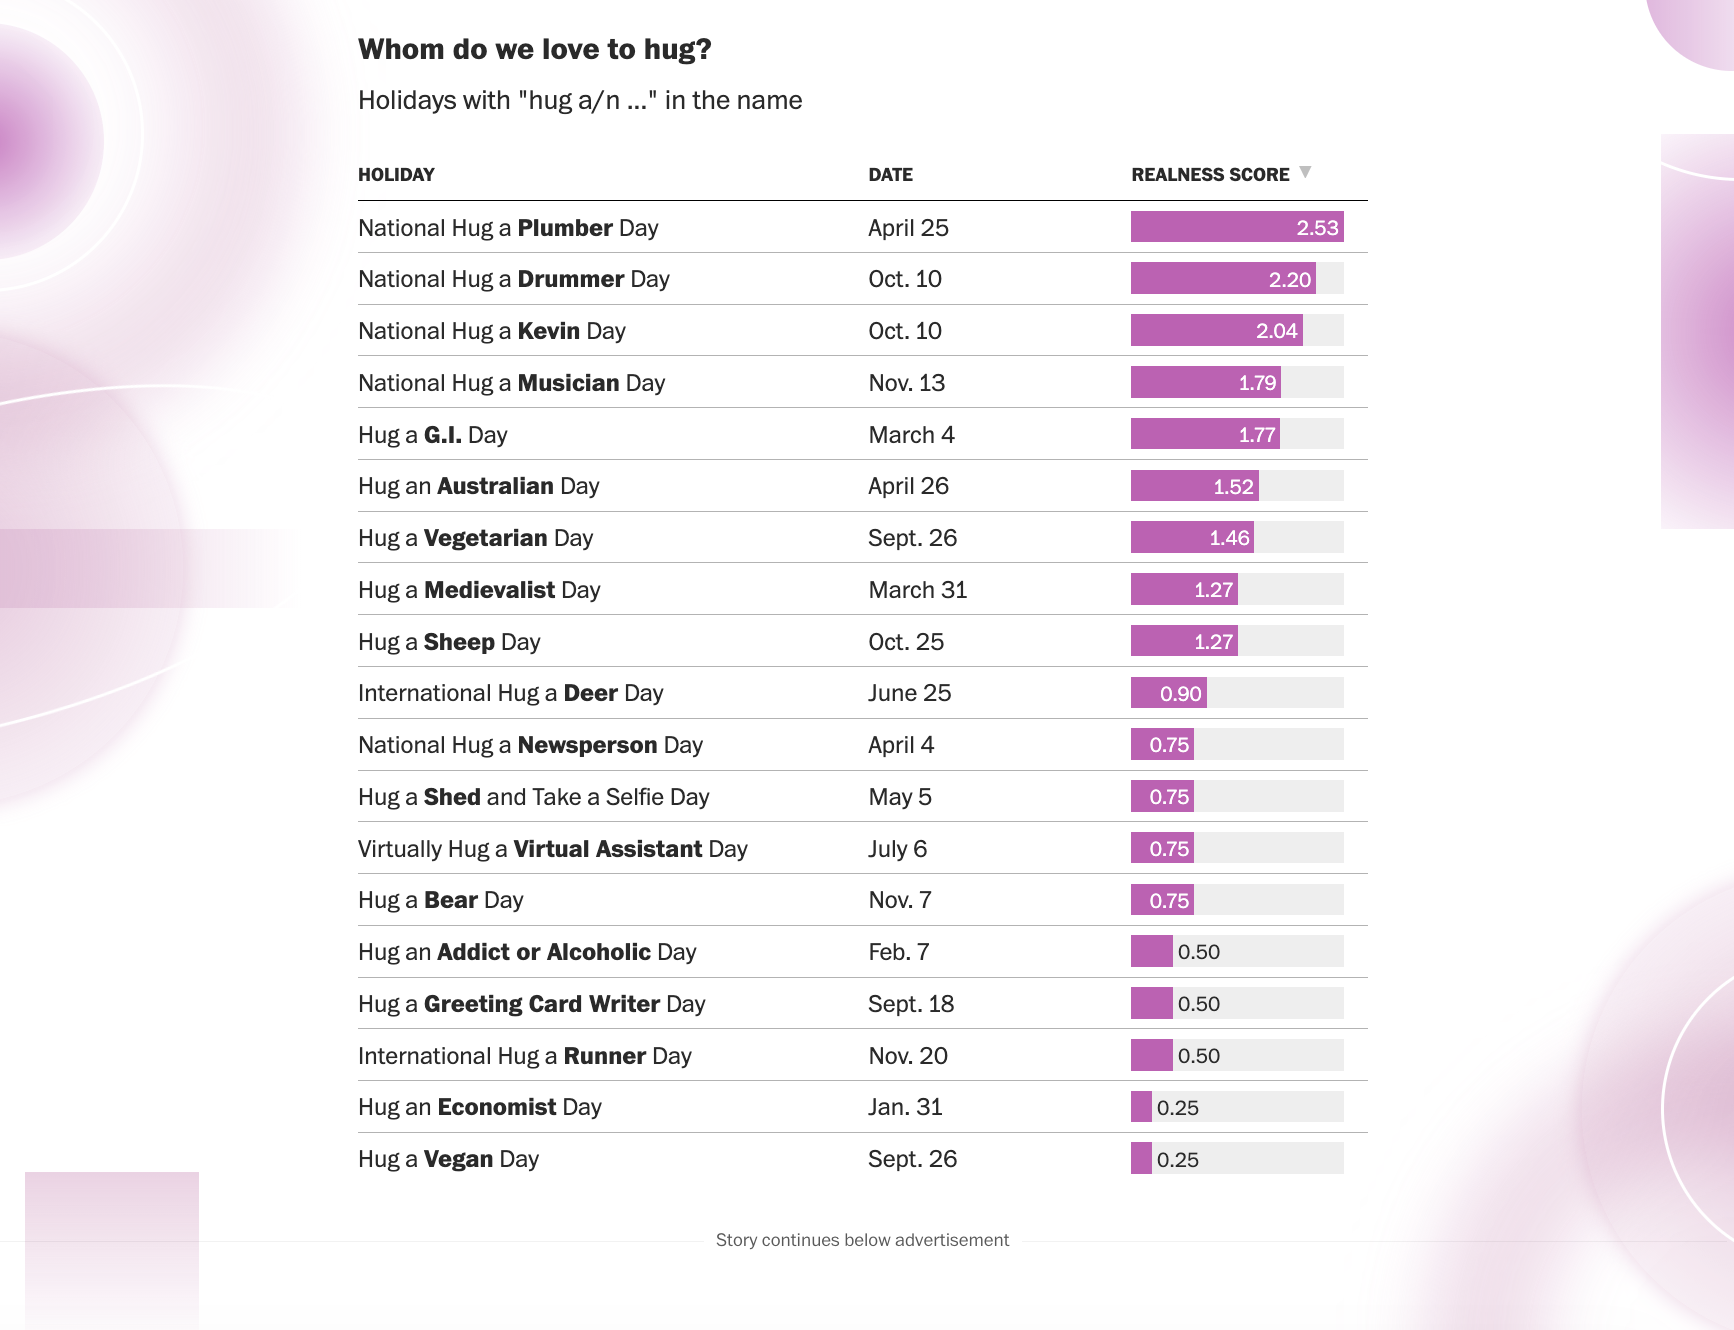
The realness ratings helped us to create an impromptu scale of likability: the “hug-a-blank” index, which rates plumbers as the most huggable and awards joint last place to economists and vegans.
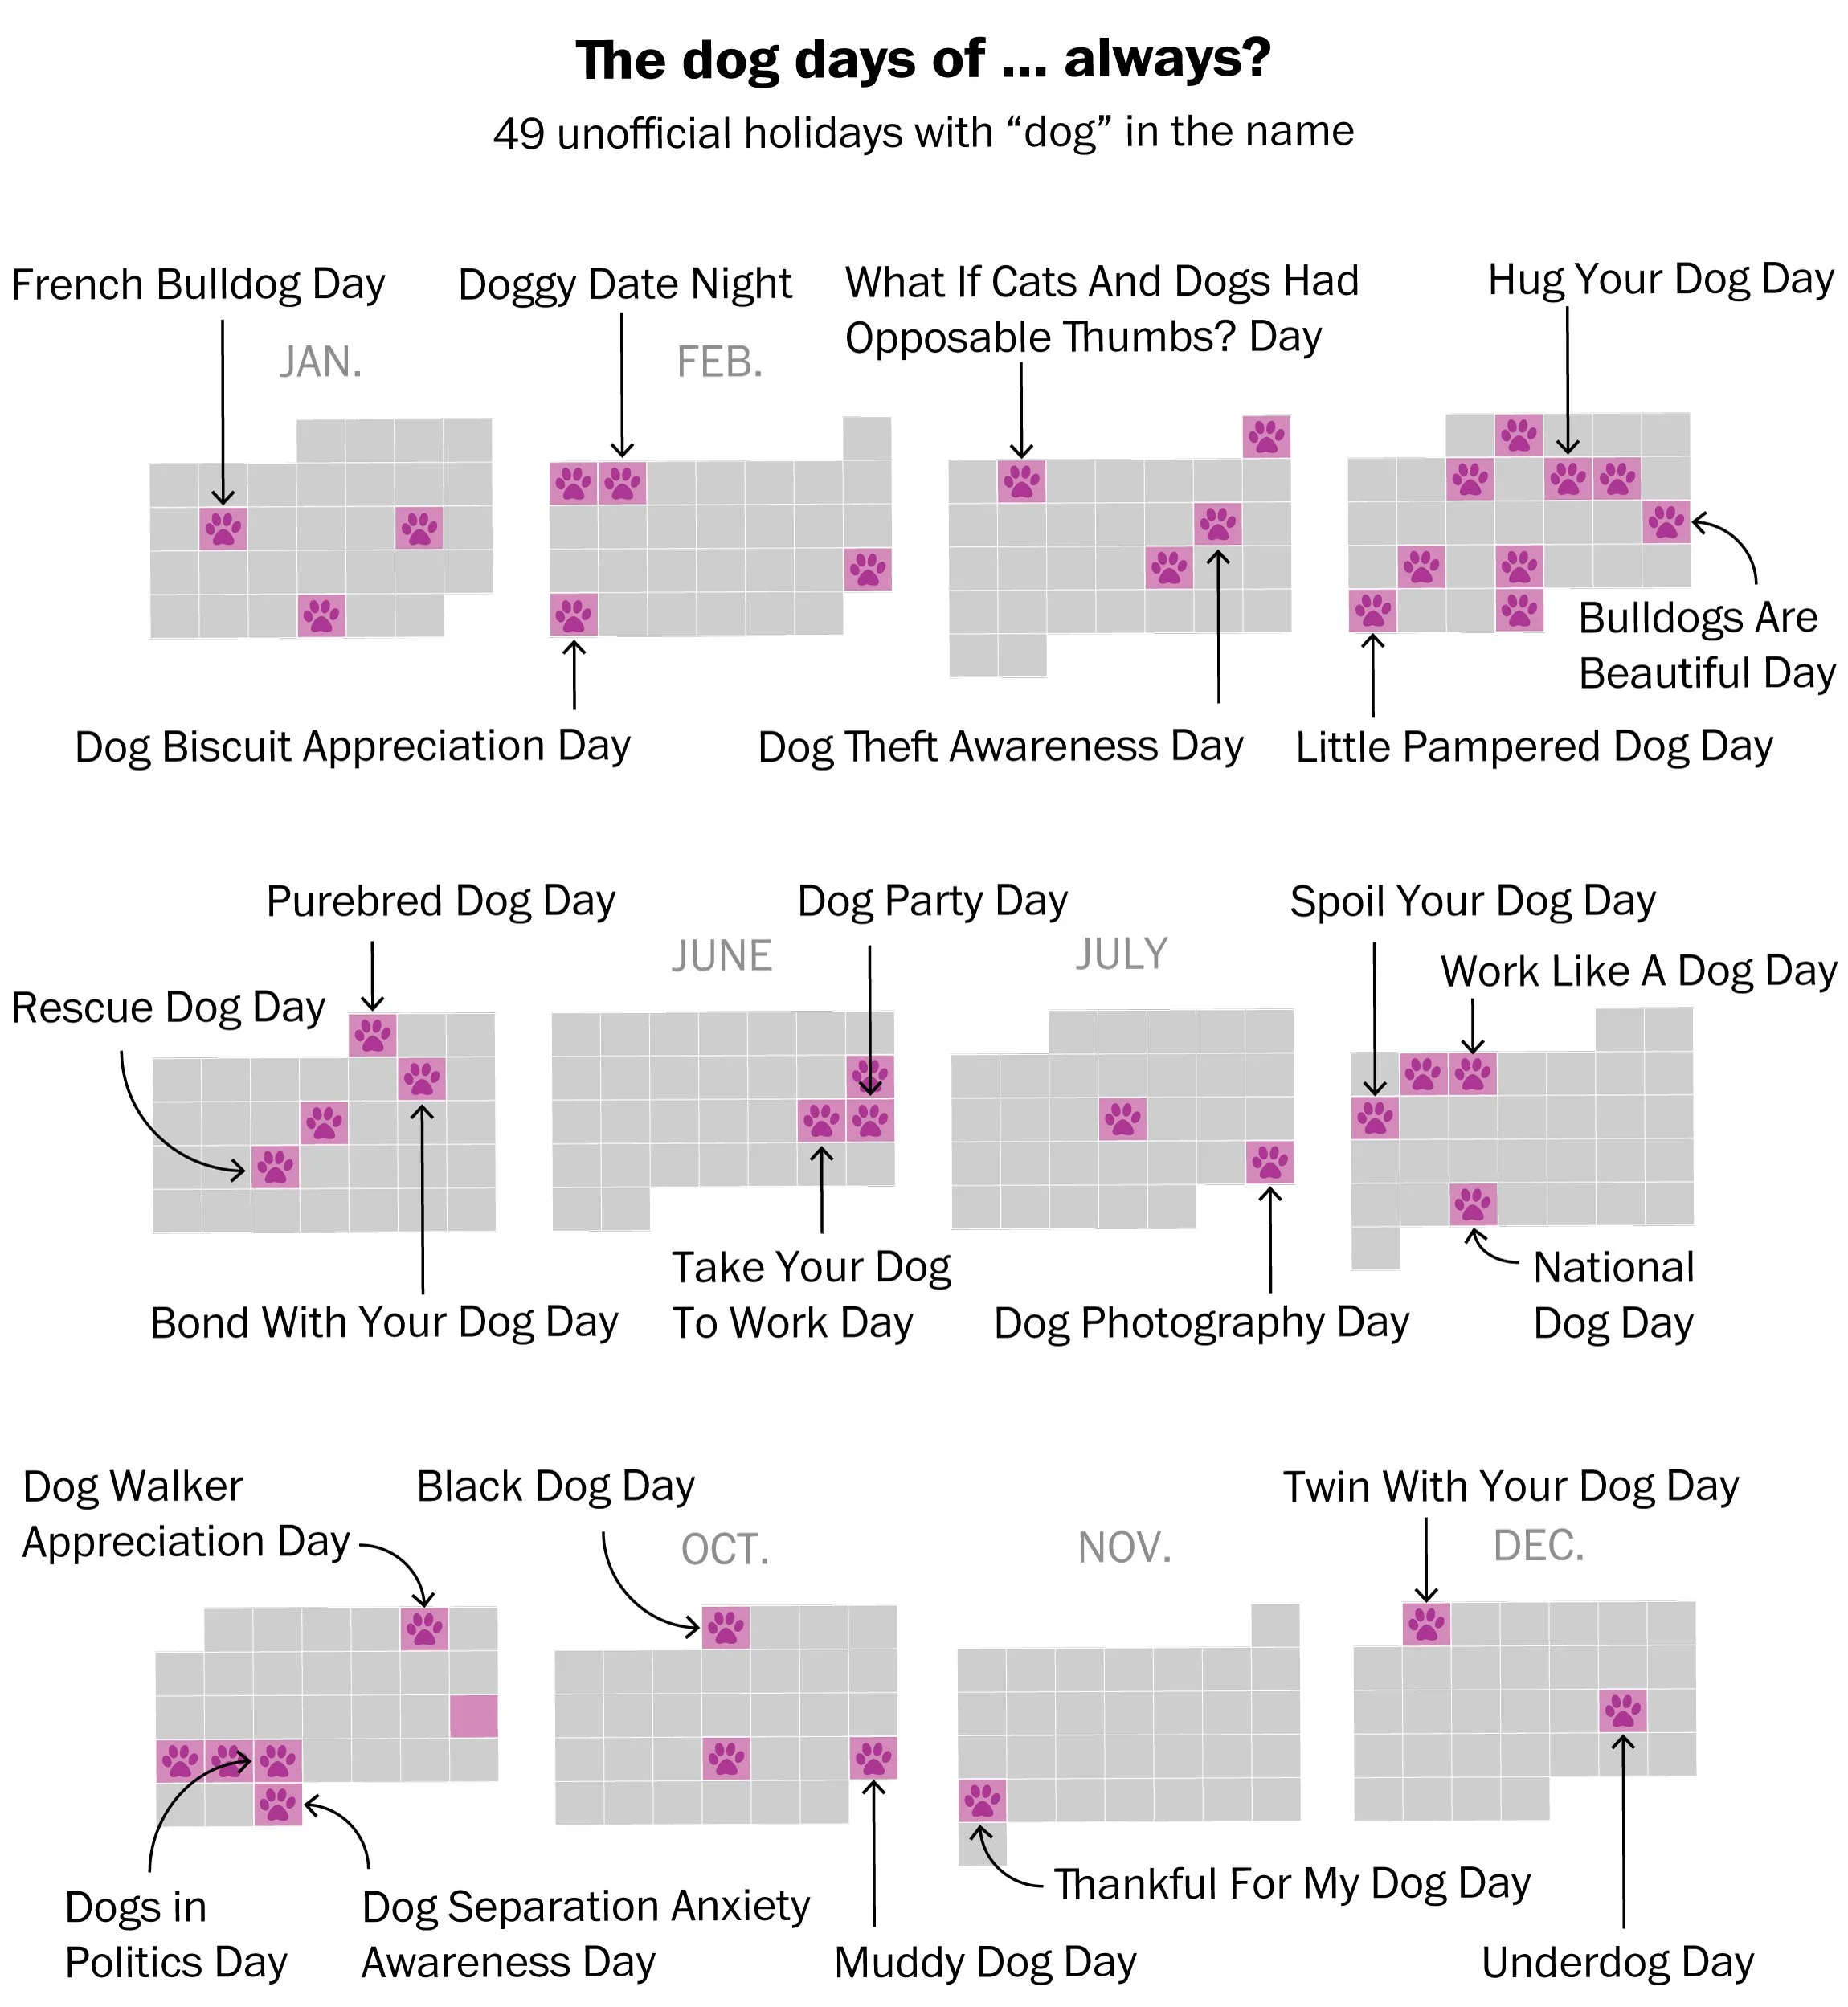
While the most work went into the realness ratings, I had the most fun examining the most common subject of holidays (dogs!) and trends in Google Search traffic. The dog calendar may be the my favorite visualization that I ever created for the Post.
Another challenge in this story was communicating our methods. What minimum baseline should be included in the main text so that readers could understand the story? What else was important to detail in the expanded methods section at the end of the story, and how could we make those details engaging enough that readers might actually check them? My usual methodology mindset is that if I made a decision, the reader deserves to know about it, so our “About This Story” section ended up being quite long.