30 years of strikes: See how the UAW walkout stacks up
by Alyssa Fowers
SABEW Honorable Mention in Breaking News
My editor asked me to create a visual story that would contextualize the historic strikes during the summer of 2023, including the SAG-AFTRA and United Auto Worker strikes. I jumped at the opportunity to create a full-page visual based on work stoppages data from Bloomberg Law, which included more strikes than work stoppage data from the Bureau of Labor Statistics.
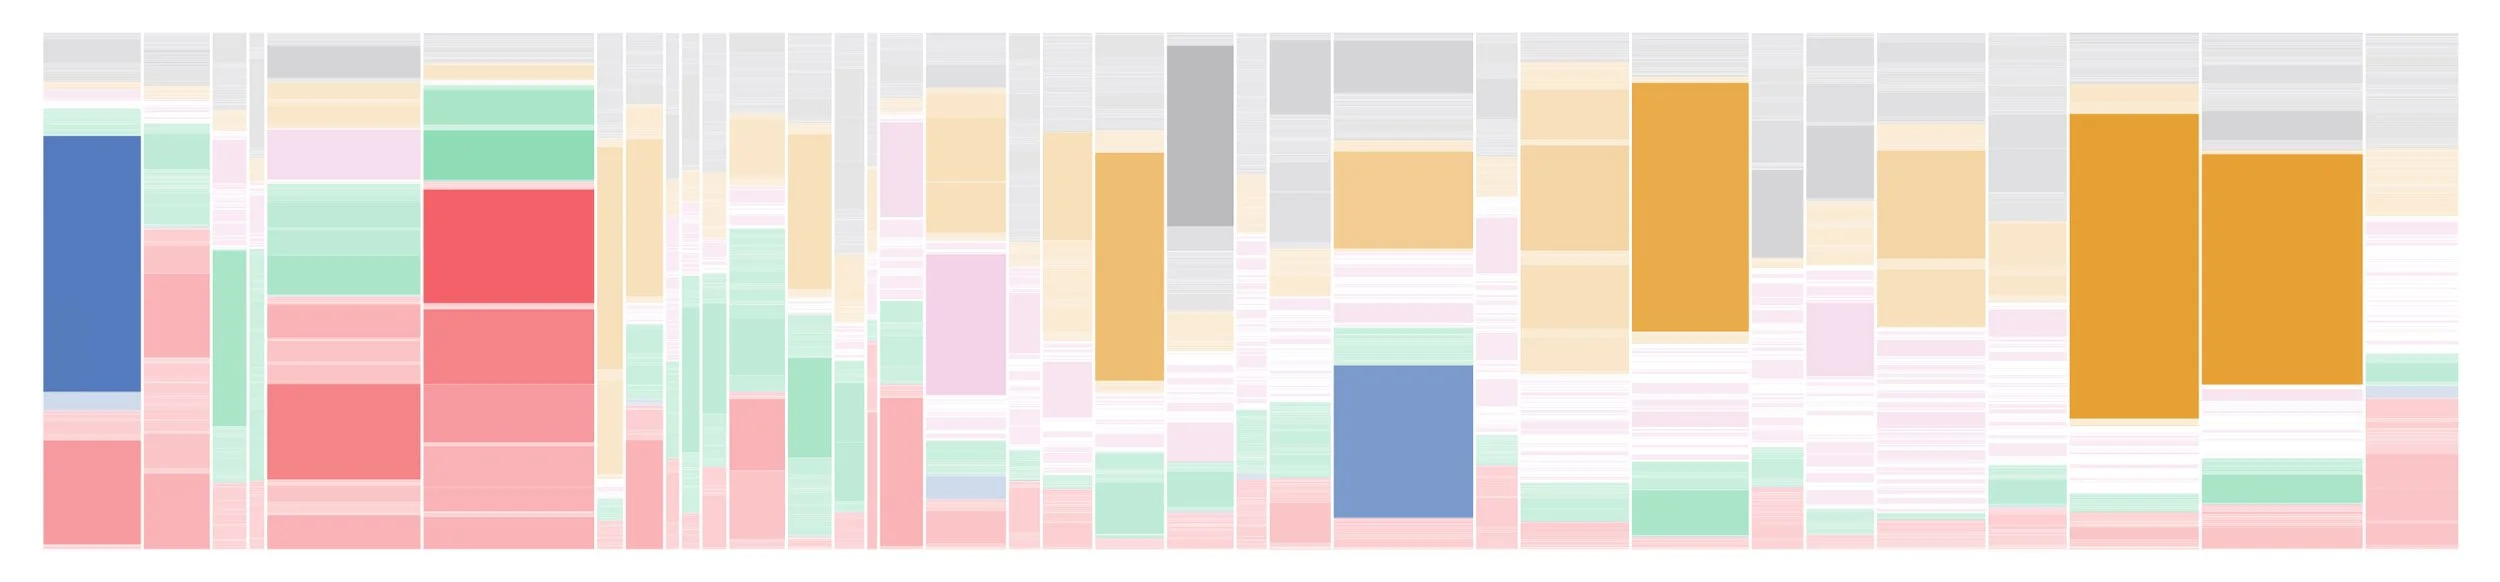
The first “piece” of the visualization, which went back to the 1990s.
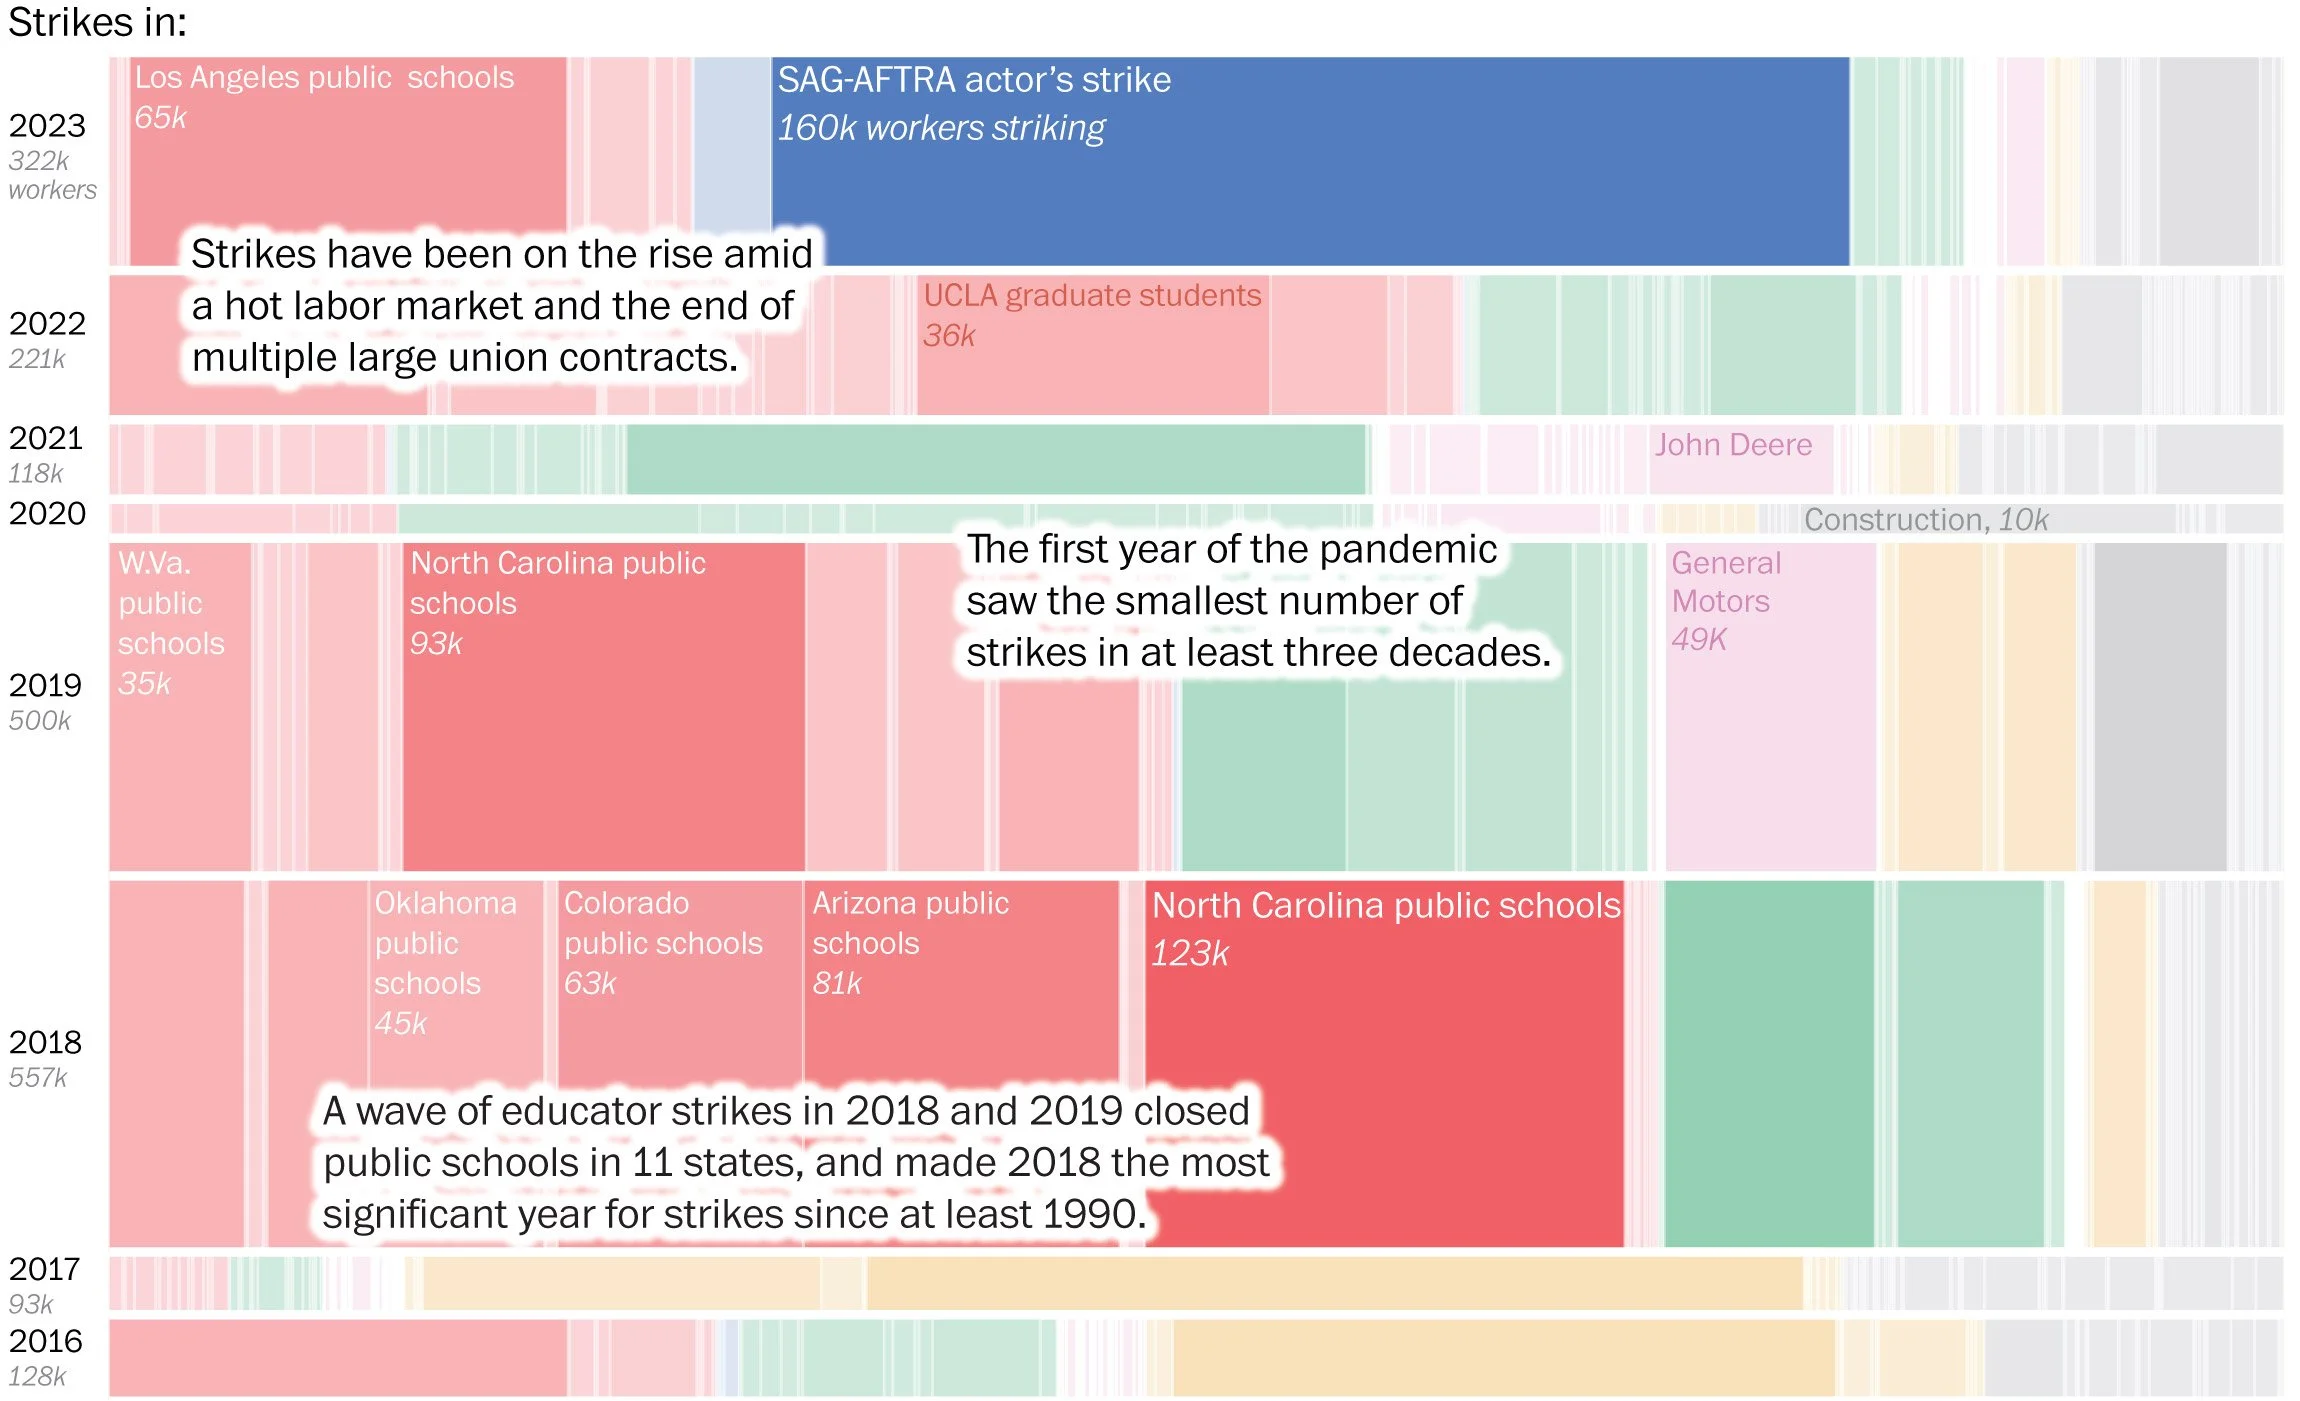
I landed on a Mondrian-inspired Marimekko chart that encoded each individual strike as a rectangle, with the height indicating the total number of workers involved in strikes each year and the width indicating what share of those workers were involved in each individual strike. By stretching the information out over an entire page, I was able to illustrate multiple different trends: the changing number and scale of strikes from the 90s to the 2020s, the industries that were most frequently involved, and the specific large strikes that drove particular years.
I used R to create the initial visual by scaling each rectangle and assigning it a color by industry. Then I exported that visual as a vector and brought it into Adobe Illustrator, where I experimented with styles, colors, labels, and overall scaling. The final desktop visual was one large ai2html graphic with overlaid annotations. The mobile version was split across multiple pieces, divided by the body text versions of the annotations.
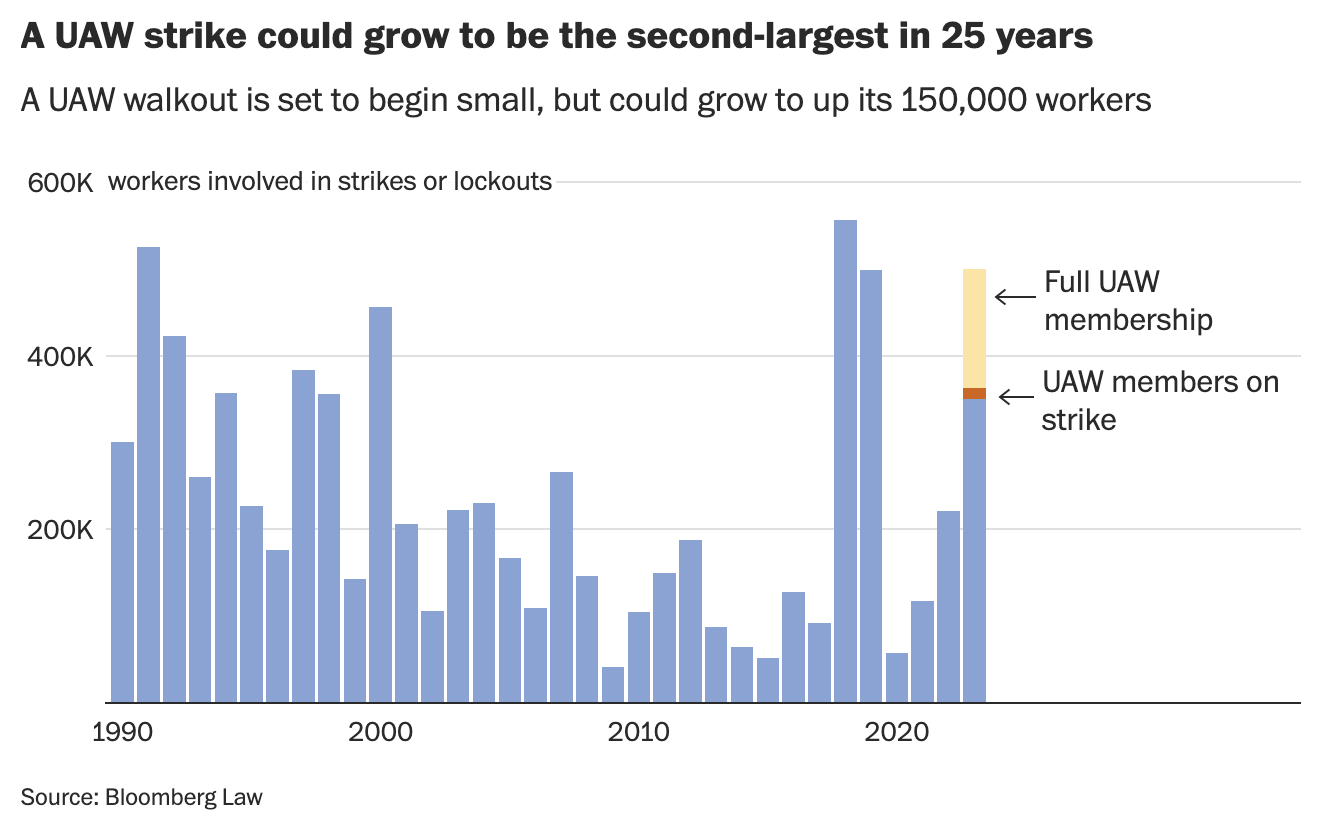
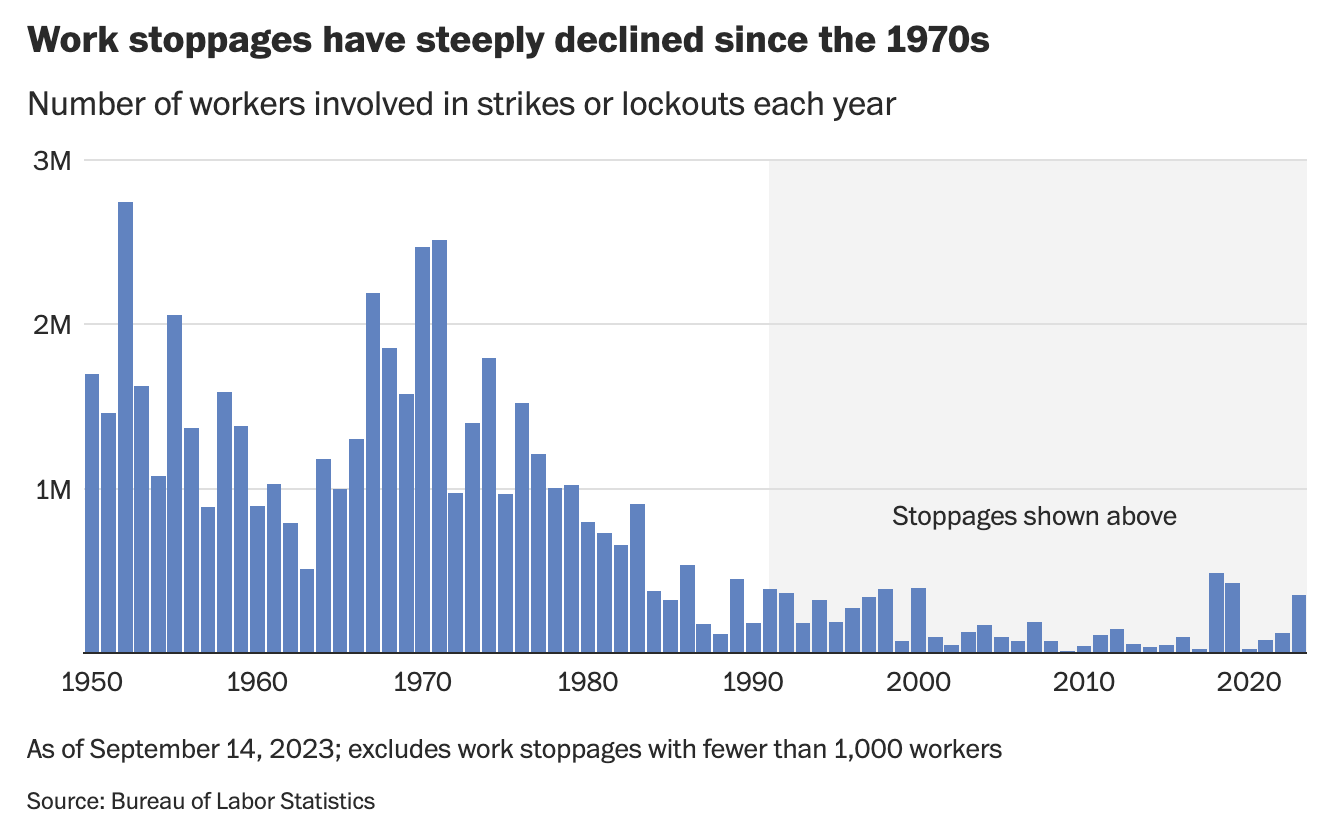
I wrote the story in parallel with creating the visual, interviewing experts to make sure I understood why the number of workers on strike changed over the decades. Based on those interviews, I added two additional charts: one showing the potential scale of the 2023 UAW strike, and one that showed how few workers went on strike in the last 30 years compared to previous decades.