Are you rich?
Concept, research, and writing by Alyssa Fowers; page design by Shelly Tan; front-end development by Luis Melgar and Chris Alcantara
Society for News Design Award of Excellence
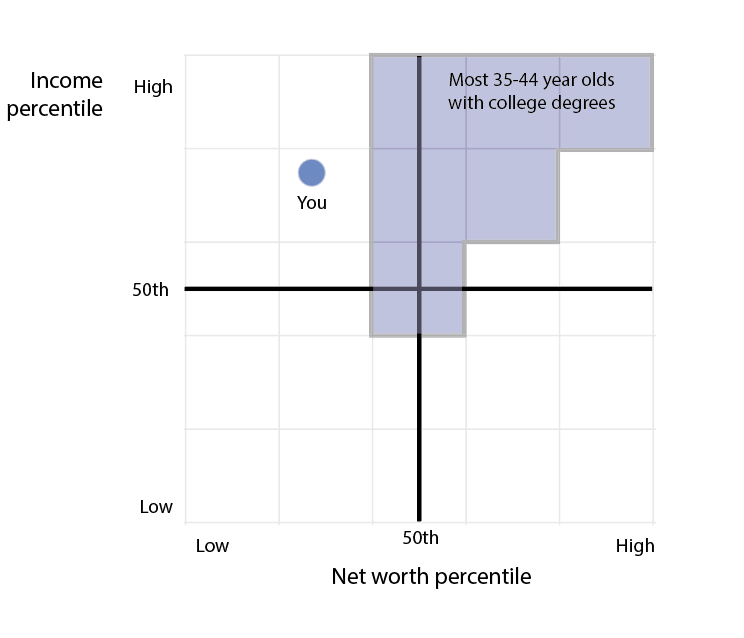
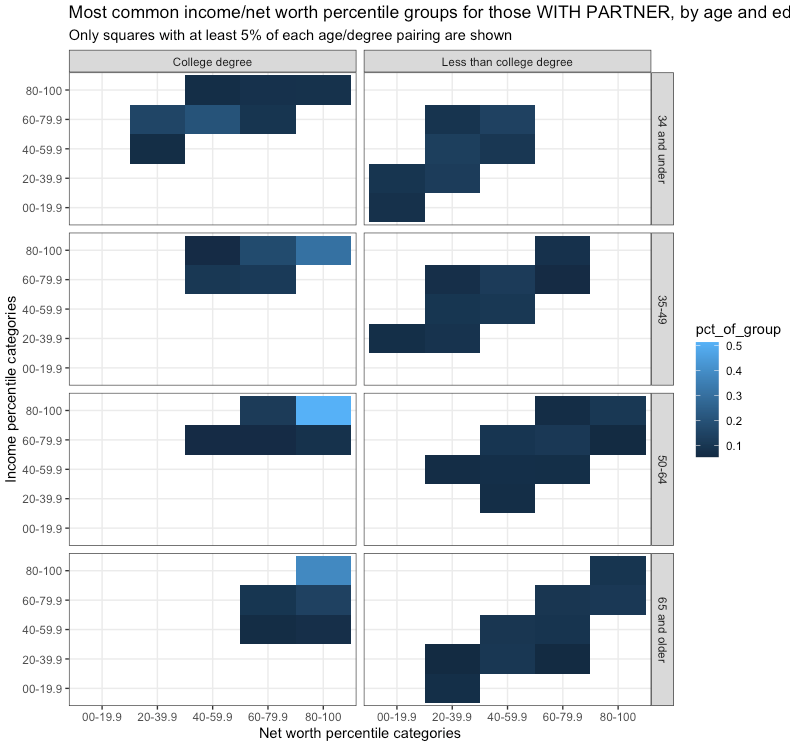
I pitched a wealth-focused interactive to take advantage of fresh Survey of Consumer Finances results released in October 2023. I used SCF microdata from the University of California Berkeley’s Survey Documentation and Analysis to show readers how their wealth compared to others like them based on age, education and race, as well as exploring the complex interaction between wealth and income for people with similar demographics.
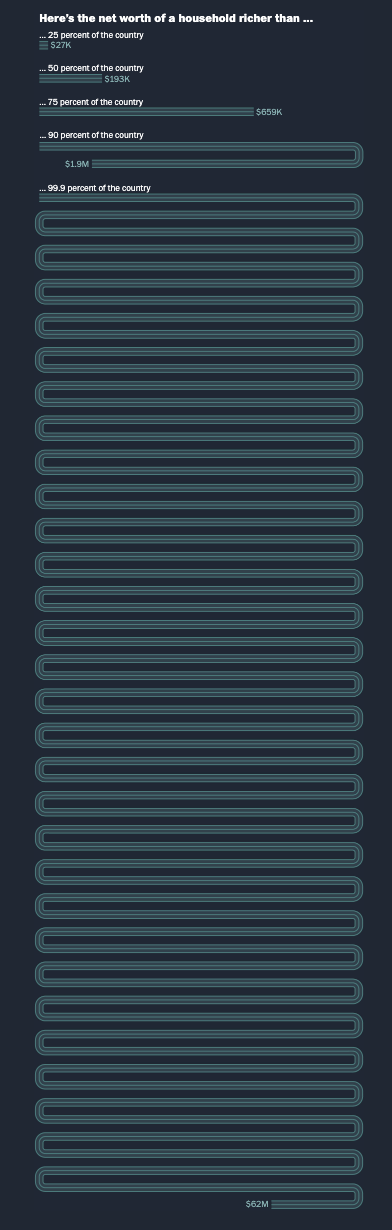
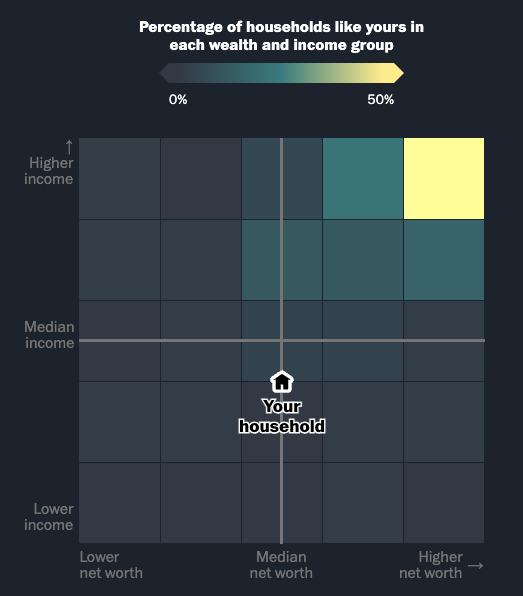
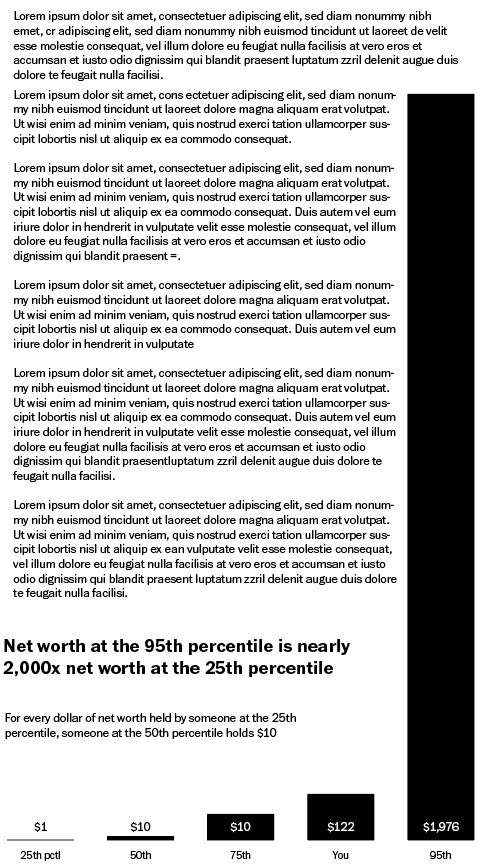
I interviewed experts and identified three potential definitions of “rich” that would give readers a sense of who might consider them wealthy and why, then coded that logic into the page. I came up with the structure of the page, setting up increasingly-personalized steps that would address readers’ questions as they moved through the interactive. I designed the charts and created the subsets of the data that showed readers how they compare to others like them. I also wrote the static text of the story and the code behind the autotext that explained readers’ results. Finally, I designed and built the “snake” chart at the end of the piece that demonstrates wealth inequality in the U.S. Shelly Tan designed the page, and Luis Melgar and Chris Alcantara coded the interactive charts based on my designs.